

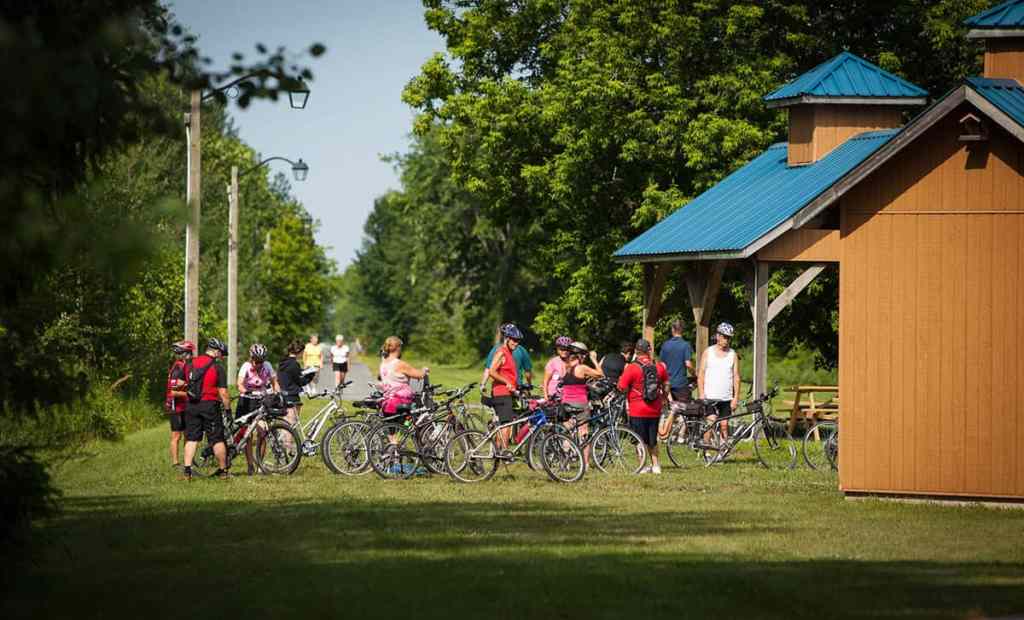
Stretching 72km across Eastern Ontario between Ottawa and the Quebec border, the Prescott-Russell Recreational Trail is a multi-use rail trail built on a former Canadian Pacific rail corridor. It’s used year-round for walking, running and cycling in the warmer months and snowmobiling and cross-country skiing in winter, and forms part of the Trans Canada Trail network.
The Prescott-Russell Recreational Trail Corporation partnered with ActiveXchange to build a reliable evidence base for how the trail is being used. The goal was to establish baseline visitation, identify which sections attract the most activity, and understand how the trail fits into people’s broader movements. That evidence is now available to support operational decisions, maintenance planning and future funding conversations.
Establish a reliable baseline for monthly and annual visitation across the entire trail.
Identify which segments of the trail see the most and least use, to guide maintenance prioritization and investment.
Capture where visitors come from, how they use the trail, and how it fits into their broader routines.
Provide quantified, defensible data to support submissions to funders and partners for continued trail investment.
The trail is deeply embedded in the daily life of the surrounding community, with strong local usage sustained throughout the year.
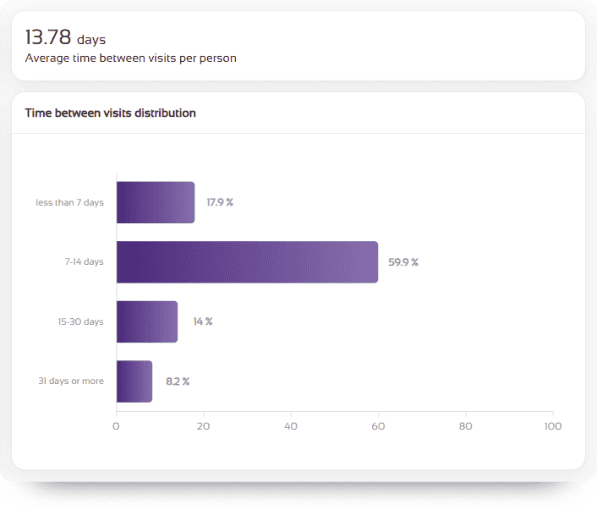
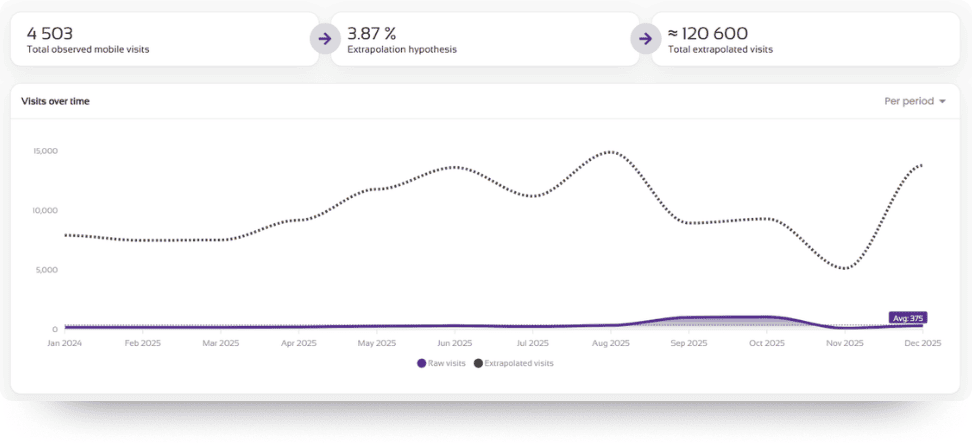
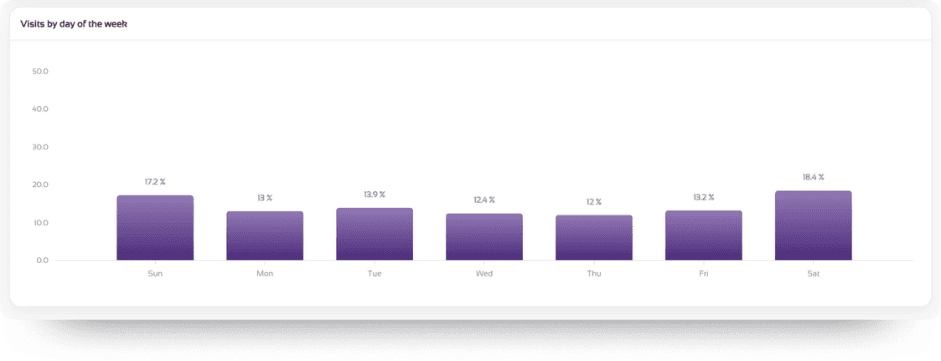
The trail serves as core community infrastructure for the surrounding municipalities, while also drawing visitors from a wider regional catchment.
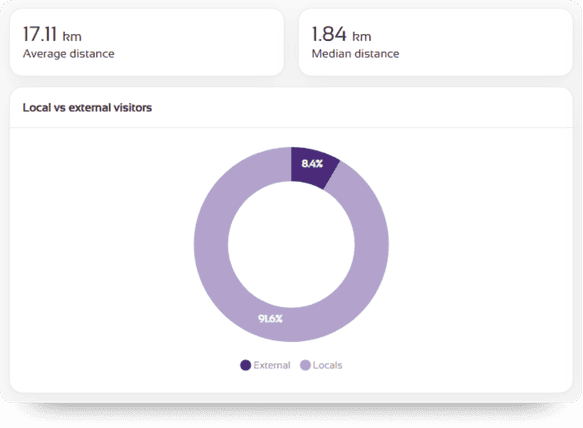
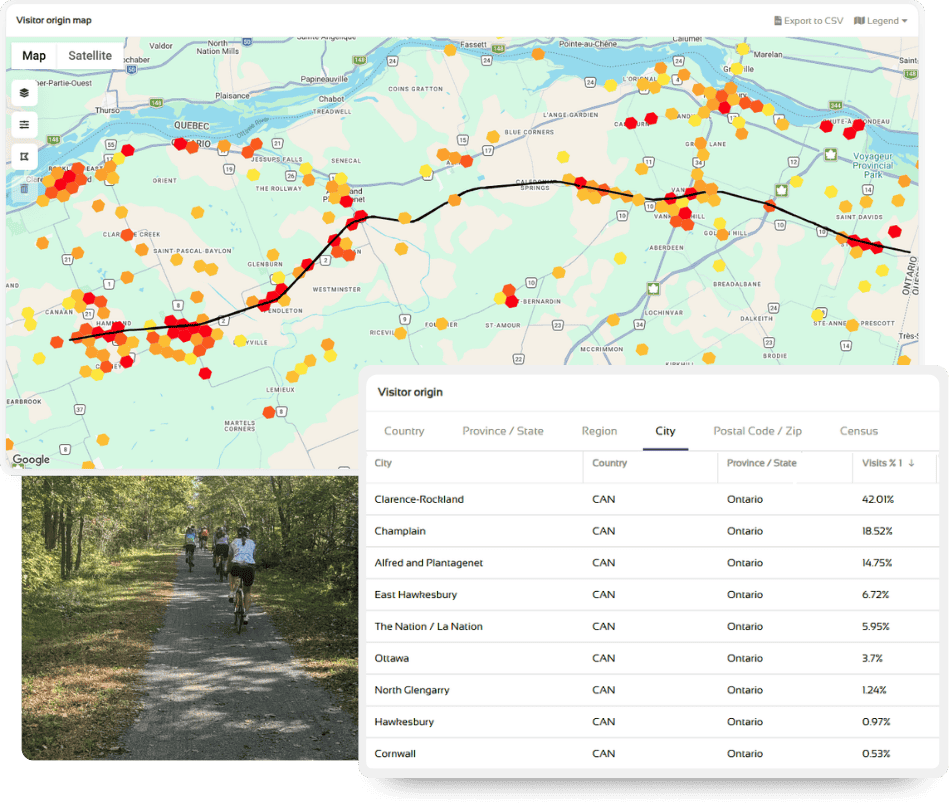
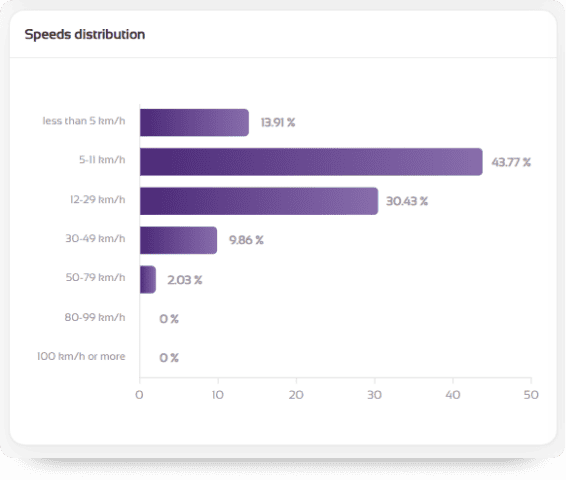
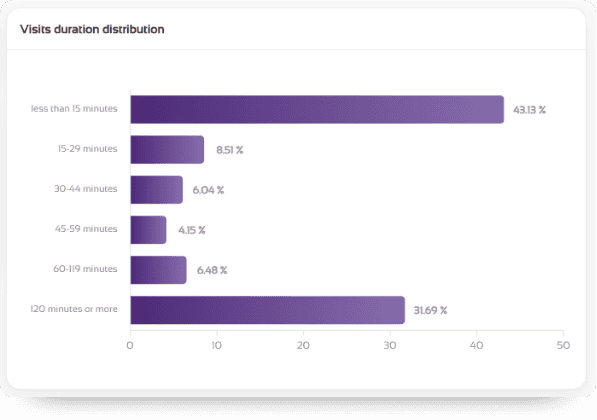
Usage patterns show the trail serves two very different needs at the same time (everyday community activity and sustained recreation) with a genuinely multi-modal user base.
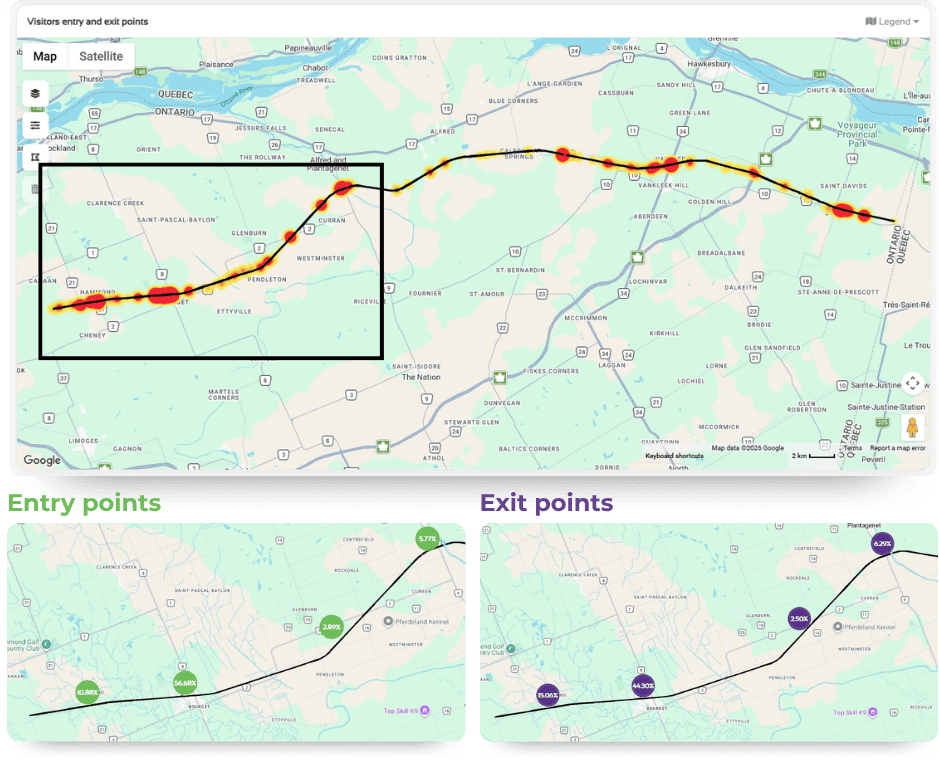
Entry and exit point data highlighted significant variation in activity along the 72km corridor, giving the Trail Corporation a clear evidence base for where maintenance investment and activation efforts will have the greatest impact.
A full year of consistent visitation data gives the Trail Corporation a defensible baseline to track trends over time, measure the impact of future investment, and report to funders and partners.
Section-level entry, exit and movement data identifies where the trail is being used most intensively and where access points are underused, supporting maintenance prioritization and investment decisions across the 72km corridor.
Quantified usage patterns (i.e. with the trail functioning as both everyday community infrastructure and a destination for sustained recreation) provide the Trail Corporation with defensible evidence for funding submissions, positioning the trail as essential to daily life in the region rather than a discretionary amenity.
Understanding both the deep local user base and the wider catchment shows who the trail is serving today and where partnership, tourism or cross-municipal opportunities may exist.
Trails, parks, greenways and other open active environments have historically been among the hardest community assets to measure. Unlike a leisure centre or a stadium, there are no gates, no bookings and no tickets, which has meant that decisions about maintenance, investment and funding have often been made without a clear picture of who is actually using the space, when, and how.
Movement Data changes that. Now, an unticketed, unstaffed, 72km-long commuinty asset can be measured with the same rigour as any built facility. That evidence base gives operators and funders a common language for conversations that used to rely on estimates and anecdote.
For any municipality, trail operator or land manager responsible for an active environment, the opportunity is the same: understand who your users are, evidence the role your asset plays in the community, and direct future investment where it will have the greatest impact.
Subscribe now to keep reading and get access to the full archive.